1. Different functionality.
Compared to other performance profilers, FreeProfiler has smaller granularity. It focuses on code block times and message processing times, not functions. So user can know exactly how much time is consumed by a specific part of a function, or how much time is consumed by a specific windows message.
Here is a typical case where FreeProfiler is useful:
You have a window callback procedure function, and you want to know which message consumes much time. So you simply add FreeProfiler macros at the beginning of your windows callback procedure, like this:
LRESULT CALLBACK AppWndProc(HWND hwnd, int message, WPARAM wParam, LPARAM lParam)
{
        FreeProfilerRecordMessageBlock(message);
        switch (message)
        {
        case WM_CREATE:
                ......
        ......
        }
        ......
}
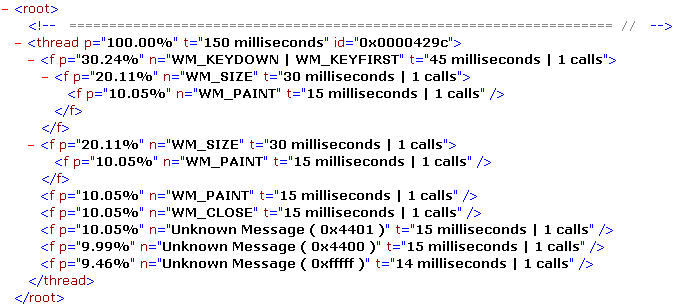
And you can view the xml-format result after you exit your application:

2. Light-weighted.
It is light-weighted. FreeProfiler has minimal impact on the performance of the application.
3. Thread-safe.
It is thread-safe. So you don’t need to worry if your function will be called by multiple-threads simultaneously.
4. Free for all uses.
It is open source and free. You can use it for any purposes under GNU Lesser General Public License.
Any suggestions please log feature request or bug report. To contact admin, please send a mail to renqilin at gmail.com
Last updated by Qilin.Ren, Jan 19th, 2009